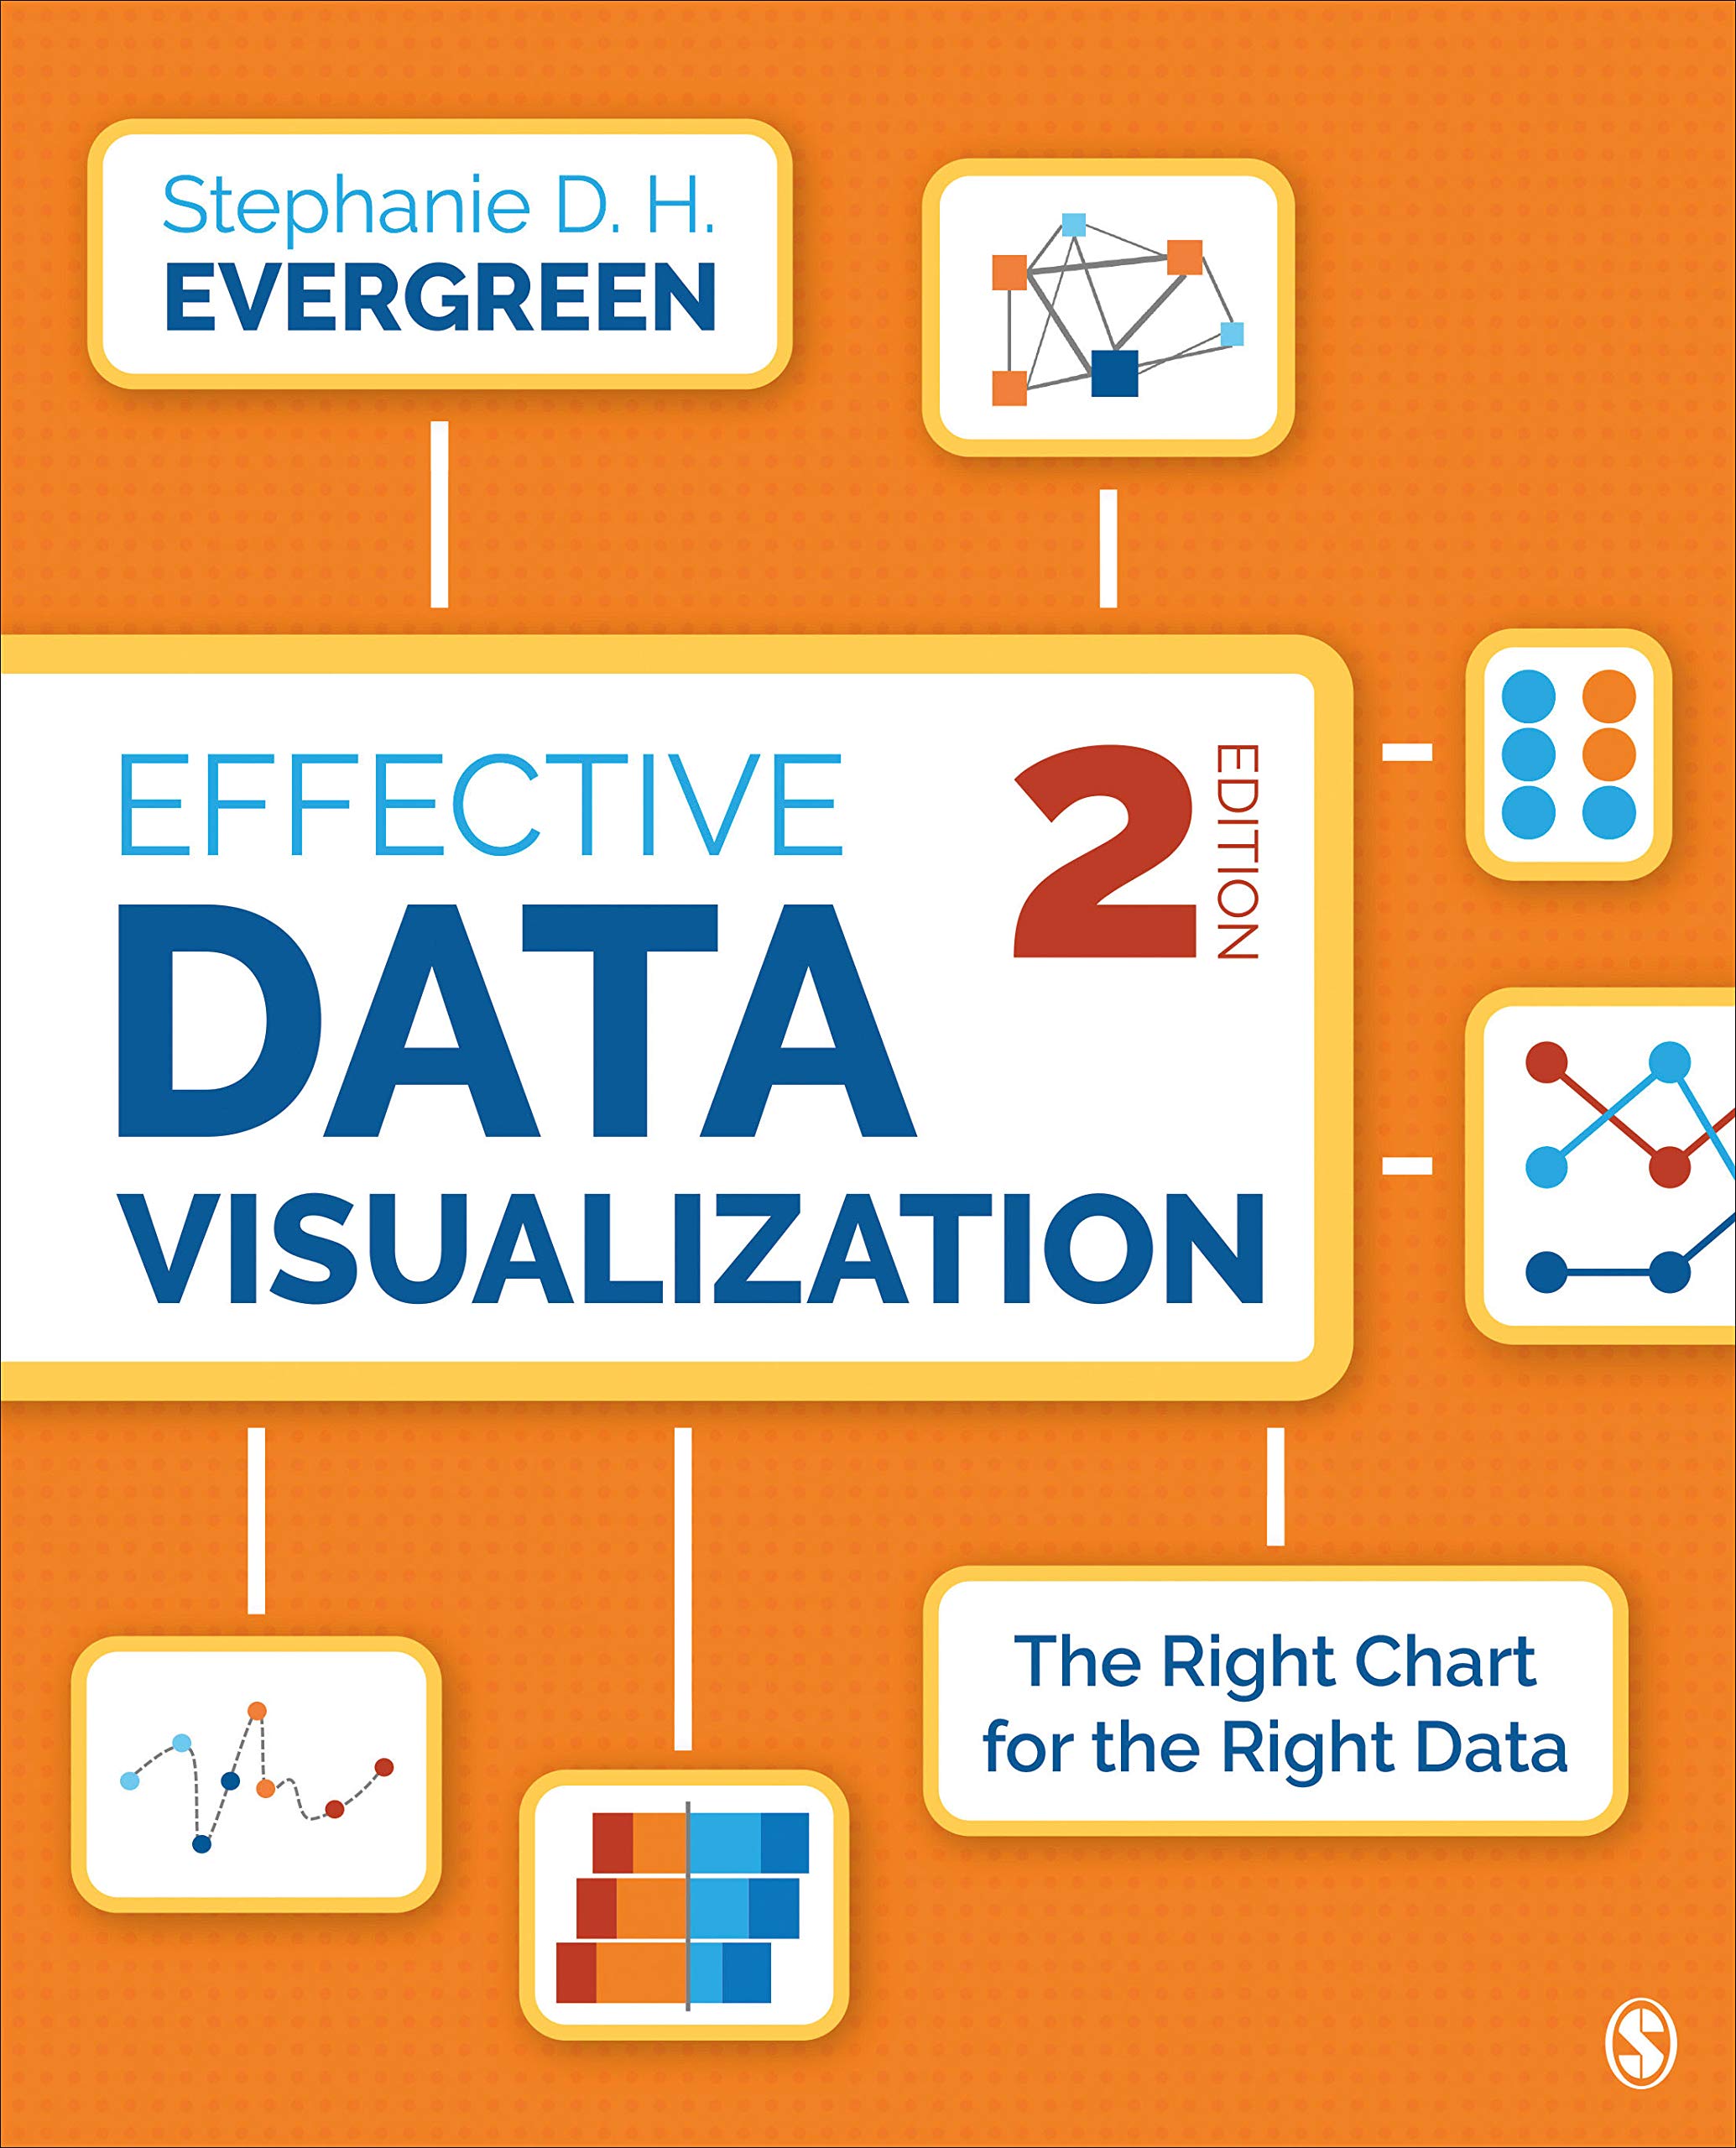
Effective Data Visualization: The Right Chart for the Right Data
Effective Data Visualization shows readers how to create Excel charts and graphs that best communicate data findings. Delivered in the author′s humorous and approachable style, the book covers the spectrum of graph types available beyond the default options, how to determine which one most appropriately fits specific data stories, and easy steps for making the chosen graph in Excel.
Related products
-

Data Visualization Guide: Clear Introduction to Data Mining, Analysis, and Visualization
Read more -

Data Visualization: Clear Introduction to Data Visualization with Python. Proper Guide for Data Scientist: 1 (Data Mining, Analytics and Visualization)
Read more -

Data Visualization: A Practical Introduction
Read more -

A History of Data Visualization and Graphic Communication
Read more


