Expanding Traditional Building Evaluations with Mobile Mapping
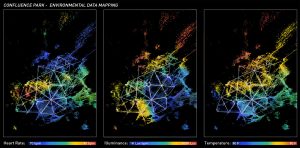
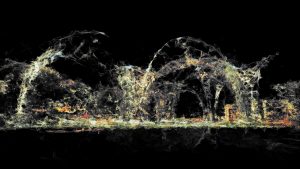
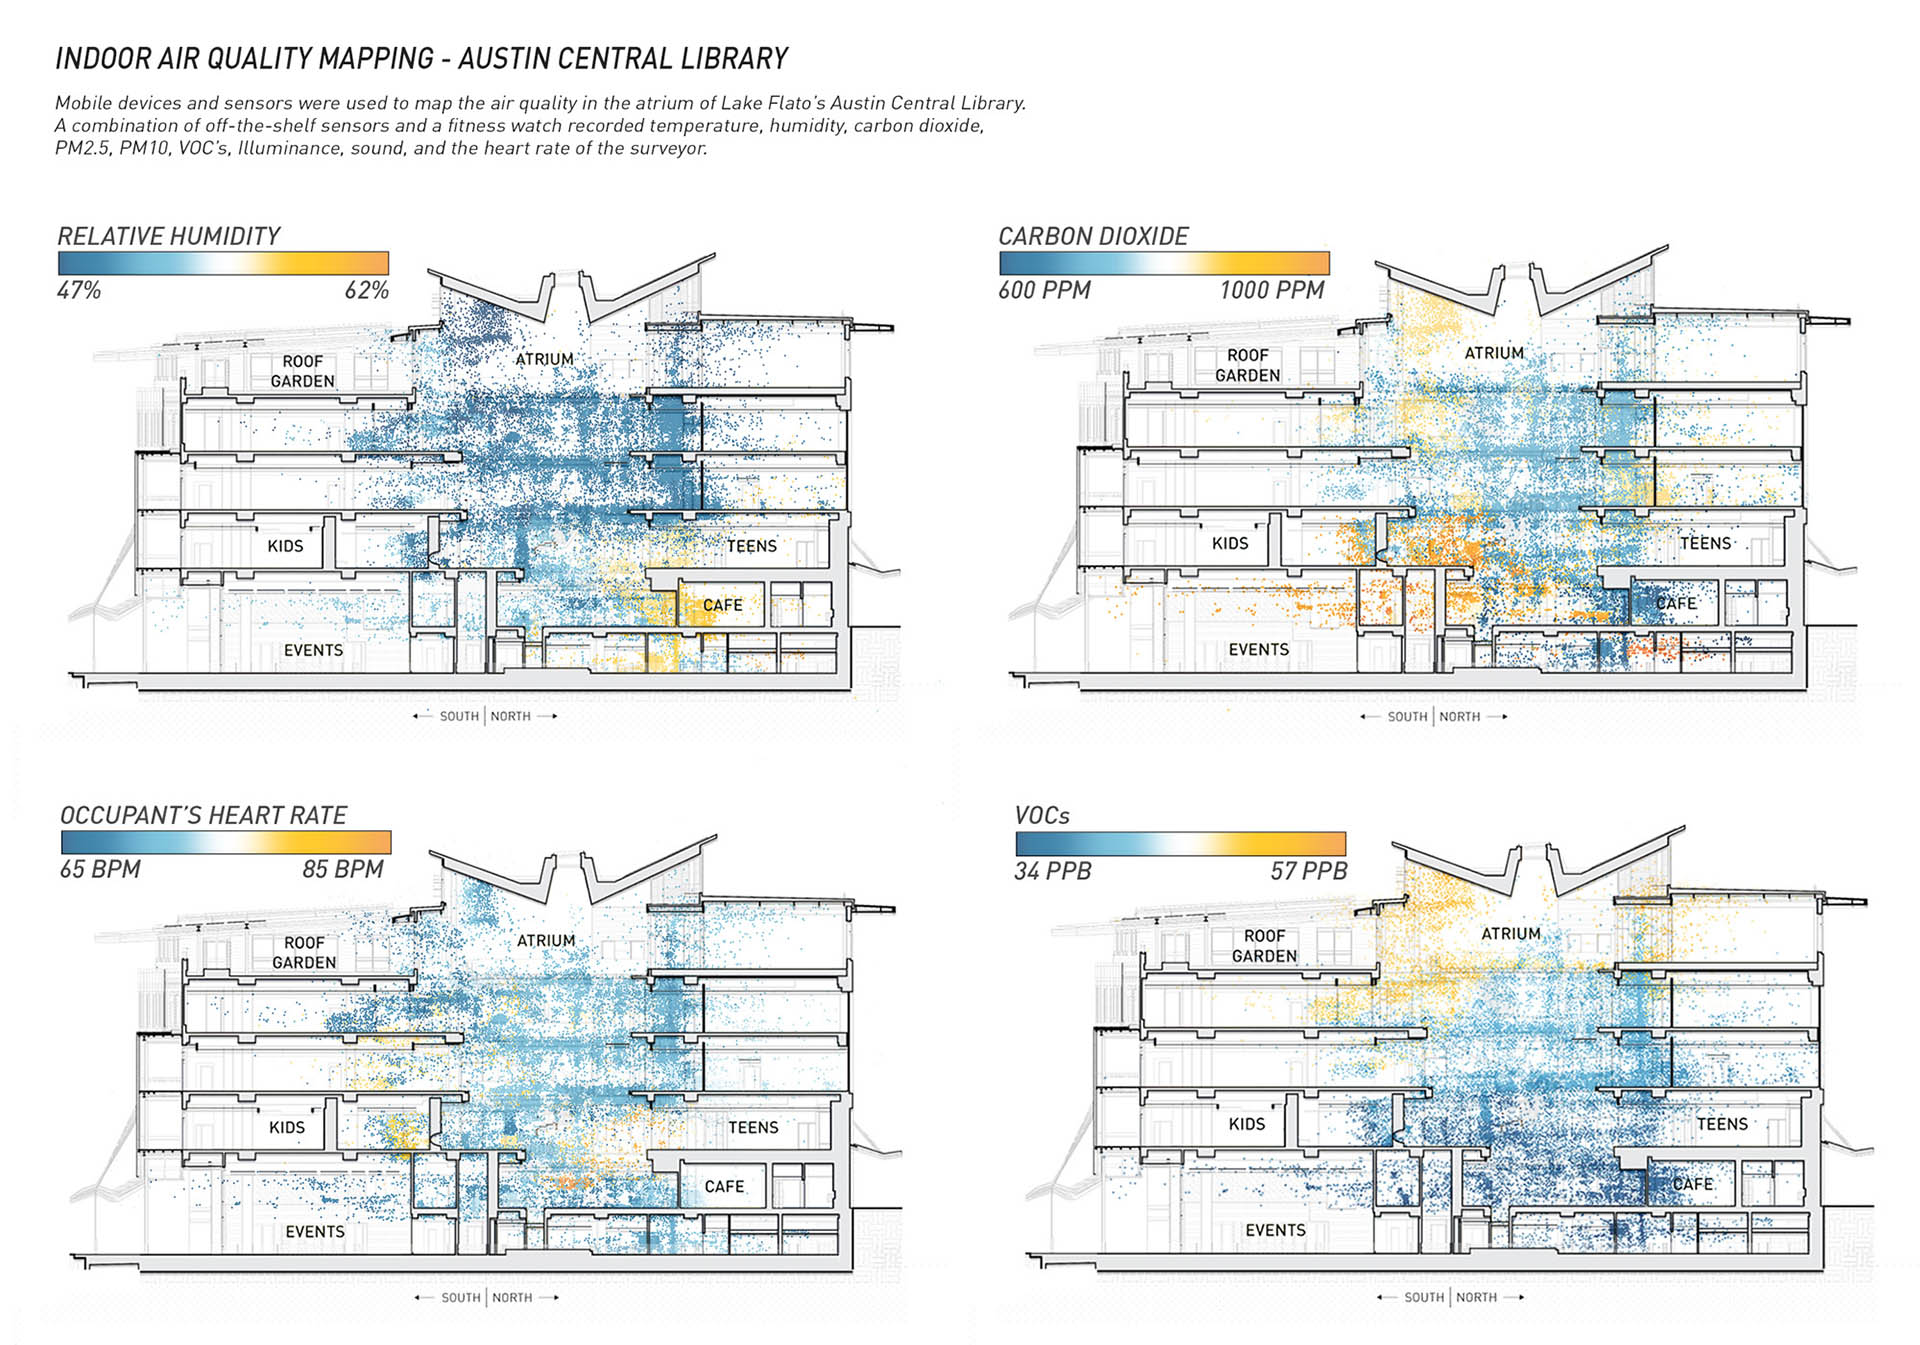
Standard building analysis is limited to questionnaires, energy monitoring, and manually recorded on-site measurements. These practices are typically time-intensive and can require the use of specialized equipment that can make these post-occupancy evaluations cost prohibitive. Adam Heisserer, a researcher in computational design, technology and data, has developed a more efficient workflow that includes more of the human experience as part of the architectural evaluation. Mobile Mapping is an automated process that expands the amount of data collected using mobile phones and off-the-shelf sensors to then generate a detailed point-cloud visualization of what Mr. Heisserer refers to as the “unseen qualities of space.” The expanded dataset includes biometrics as a way to more carefully measure the human experience. By emphasizing the importance of biometric data, architects can better understand the impact their designs have beyond its energy performance. We spoke with Mr. Heisserer about this developing process and how this technique will impact the way architects understand the effect of their designs.
Tell us about your academic and professional background.
I went to the University of Texas at Arlington where I got a Masters in Architecture. My focus was on digital fabrication technologies and research. It was a well-rounded program with drawing and design fundamentals as well as computational design. Later I joined the sustainability team at Lake Flato in San Antonio. This was a role that focused on data-driven building performance and sustainable design. It was a broad technologist role that included everything from keeping up with VR, drones and parametric design, to building performance tasks such as daylight modeling and energy modeling.

As a Design Technologist with Lake | Flato you implemented new technologies and research programs for building design and evaluation. Can you explain the role data played in developing these new techniques and how that influenced the design of a project?
Lake Flato has a post occupancy program that includes energy monitoring, occupant surveys, and mapping environmental data. The challenge is to have enough reliable data to be able to quantify the value of high-performance design. For example, we monitored hourly energy consumption of about 16 projects for the first couple of years after they were completed. After a few years, we had a substantial database of building energy, broken down by each circuit in the building. We use that data to fine-tune systems in the building and potentially save thousands of dollars in energy bills for the owners, as well as inform our own designers about which systems worked as expected and which didn’t.
Your Mobile Mapping technique expands traditional building evaluations to include additional environmental and biometric aspects and generate maps that visualize the unseen qualities of space. Tell us about how you developed this system and the workflow from data collection to visualization.
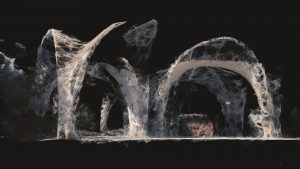
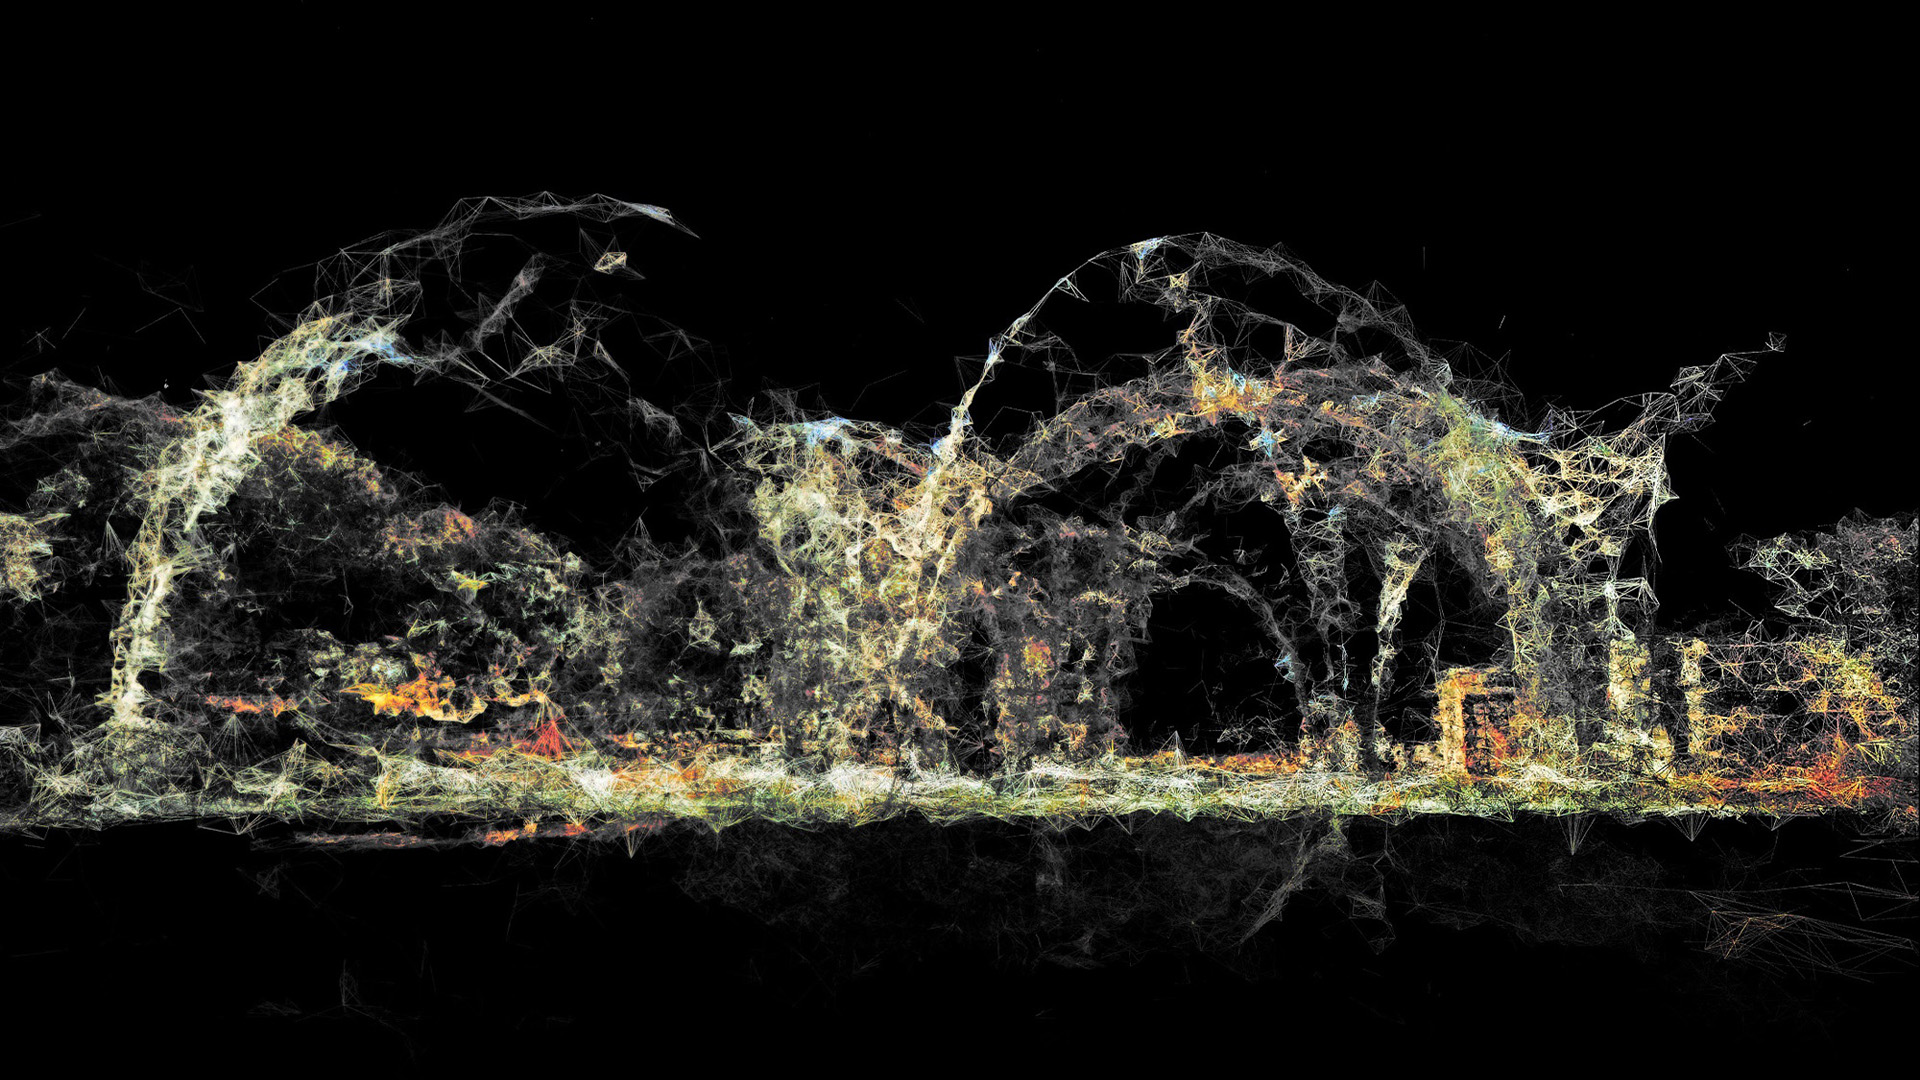
It started as a way to streamline on-site data collection. Most post-occupancy evaluations are done by manually recording data, point by point. Mobile Mapping is about recording someone’s position in space while recording environmental data, and then combining the two into a map of the space. Recording position can be done with GPS for large outdoor spaces, but small indoor spaces require a more precise method. Photogrammetry is a process that reconstructs a 3D model of a space from photographs, and it can be an effective way of modeling a space while recording the camera’s position. I do this modeling with a structure-from-motion framework called COLMAP, and I use Grasshopper and Rhino to map the data collected in a digital model.
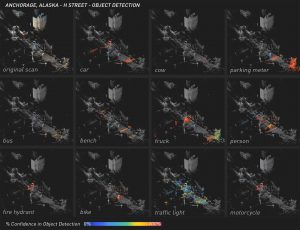
Another goal is to expand the types of data that architects typically collect. In addition to illuminance and sound levels, I was also interested in using off-the-shelf devices to record data such as air quality, heart rate, and object detection. As these devices become more accurate and available, researchers will have an increasingly accurate understanding of how people experience spaces.
Could you talk about one of your latest projects that make use of mobile mapping and how data is used in the workflow for this project?
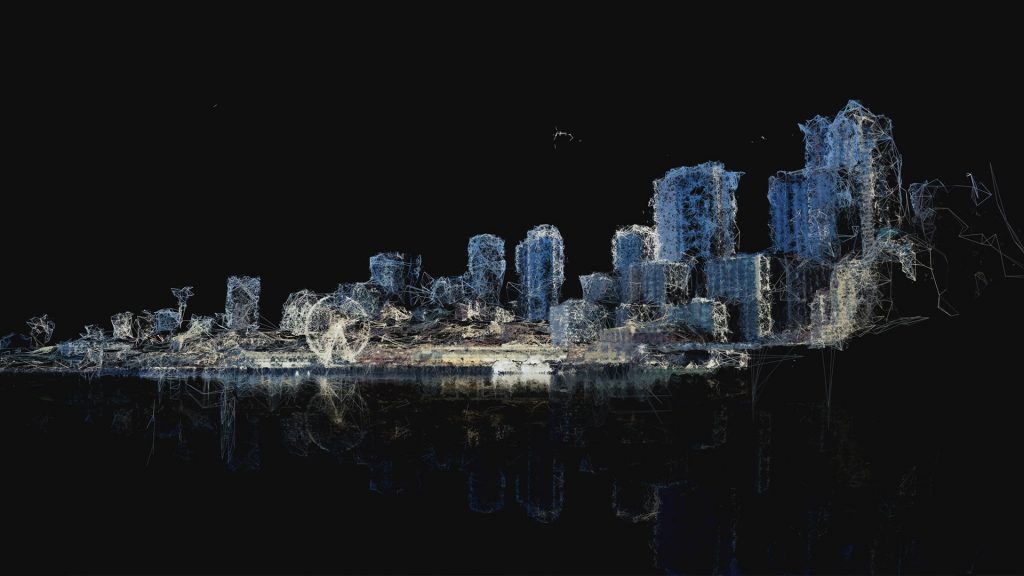
Lately I’ve been interested in getting the most data from the fewest possible devices, rather than carrying a phone, Arduino, air quality sensor, daylight meter, etc. I’ve been experimenting with using a single GoPro camera to do some urban mapping of Anchorage, Alaska. I’m using the metadata built into the GoPro to record GPS and other environmental settings like audio levels, luminance, and acceleration as I’m walking through the city. Then the video can be used to make a photogrammetry model, or it can be processed with an object-detection system to map objects through the city. A single camera has a lot of implicit data about how the subject is moving through a space, what they look at, and what they experience.
Similar to the Mobile Mapping for building evaluations, you have explored photogrammetry and Grasshopper as a way to generate drawings. How does your process change from technical to artistic outputs?
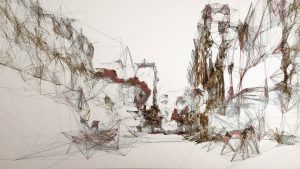
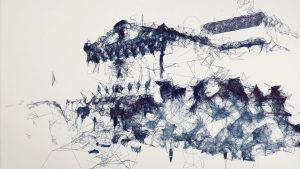
The photogrammetry model was a nice byproduct of recording a camera’s position in a space. I think it’s most compelling to show environmental data mapped onto the surfaces themselves, not just as a grid floating in space. I started joining the points of the point cloud into a mesh as a way to make the point cloud more dense. The result is a strange combination of what the human sees and what the computer sees. I have to be selective about what to capture, so the drawing remains legible. Point clouds can easily become an unrecognizable mess. The photogrammetry drawings I make are usually more personal exercises in recording places that are memorable to me.

